Graphs
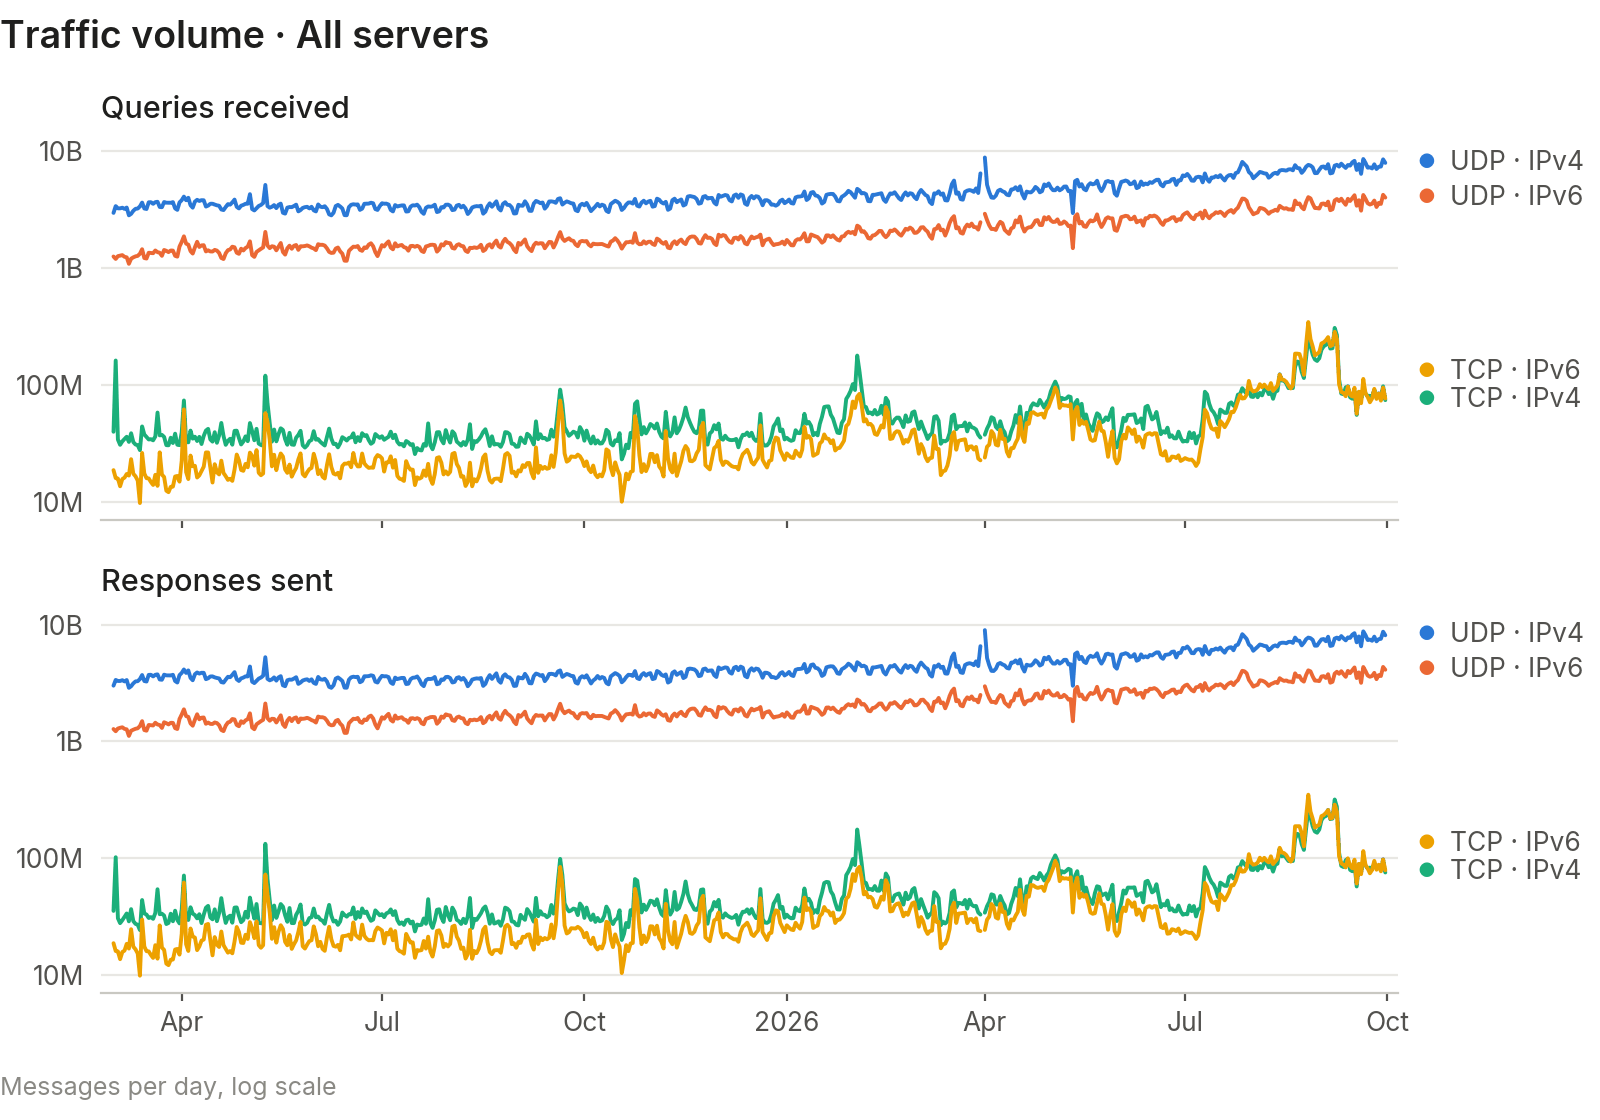
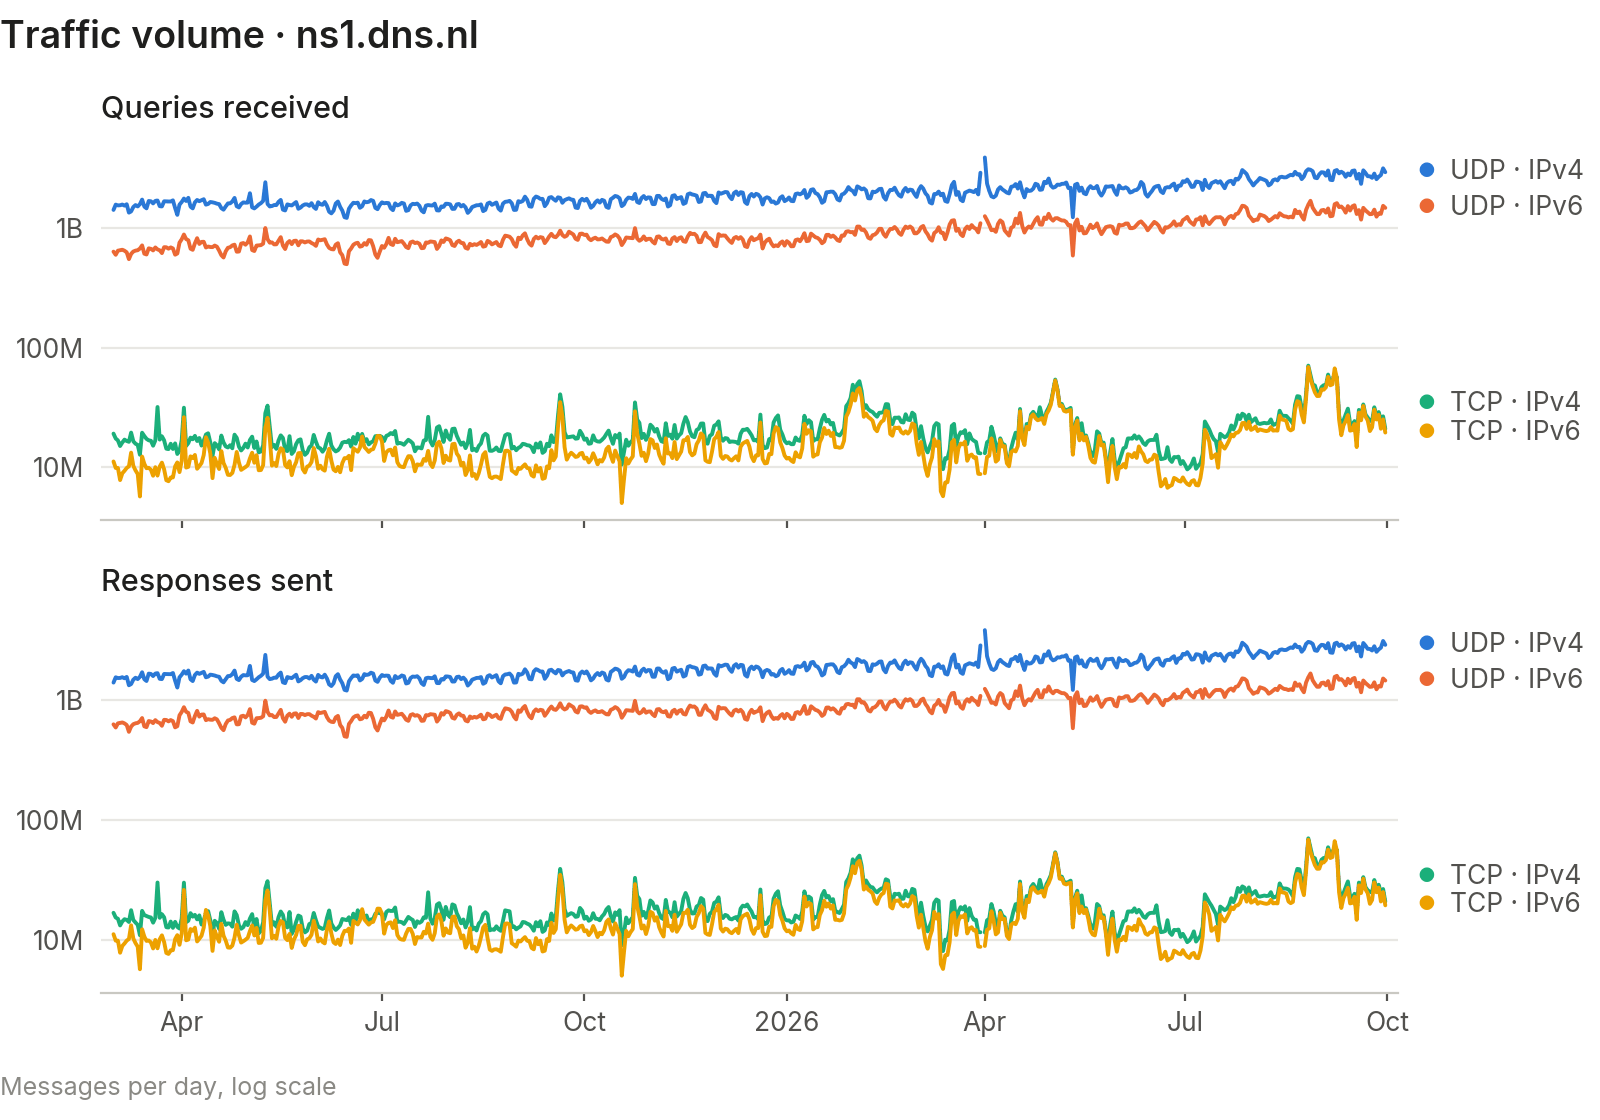
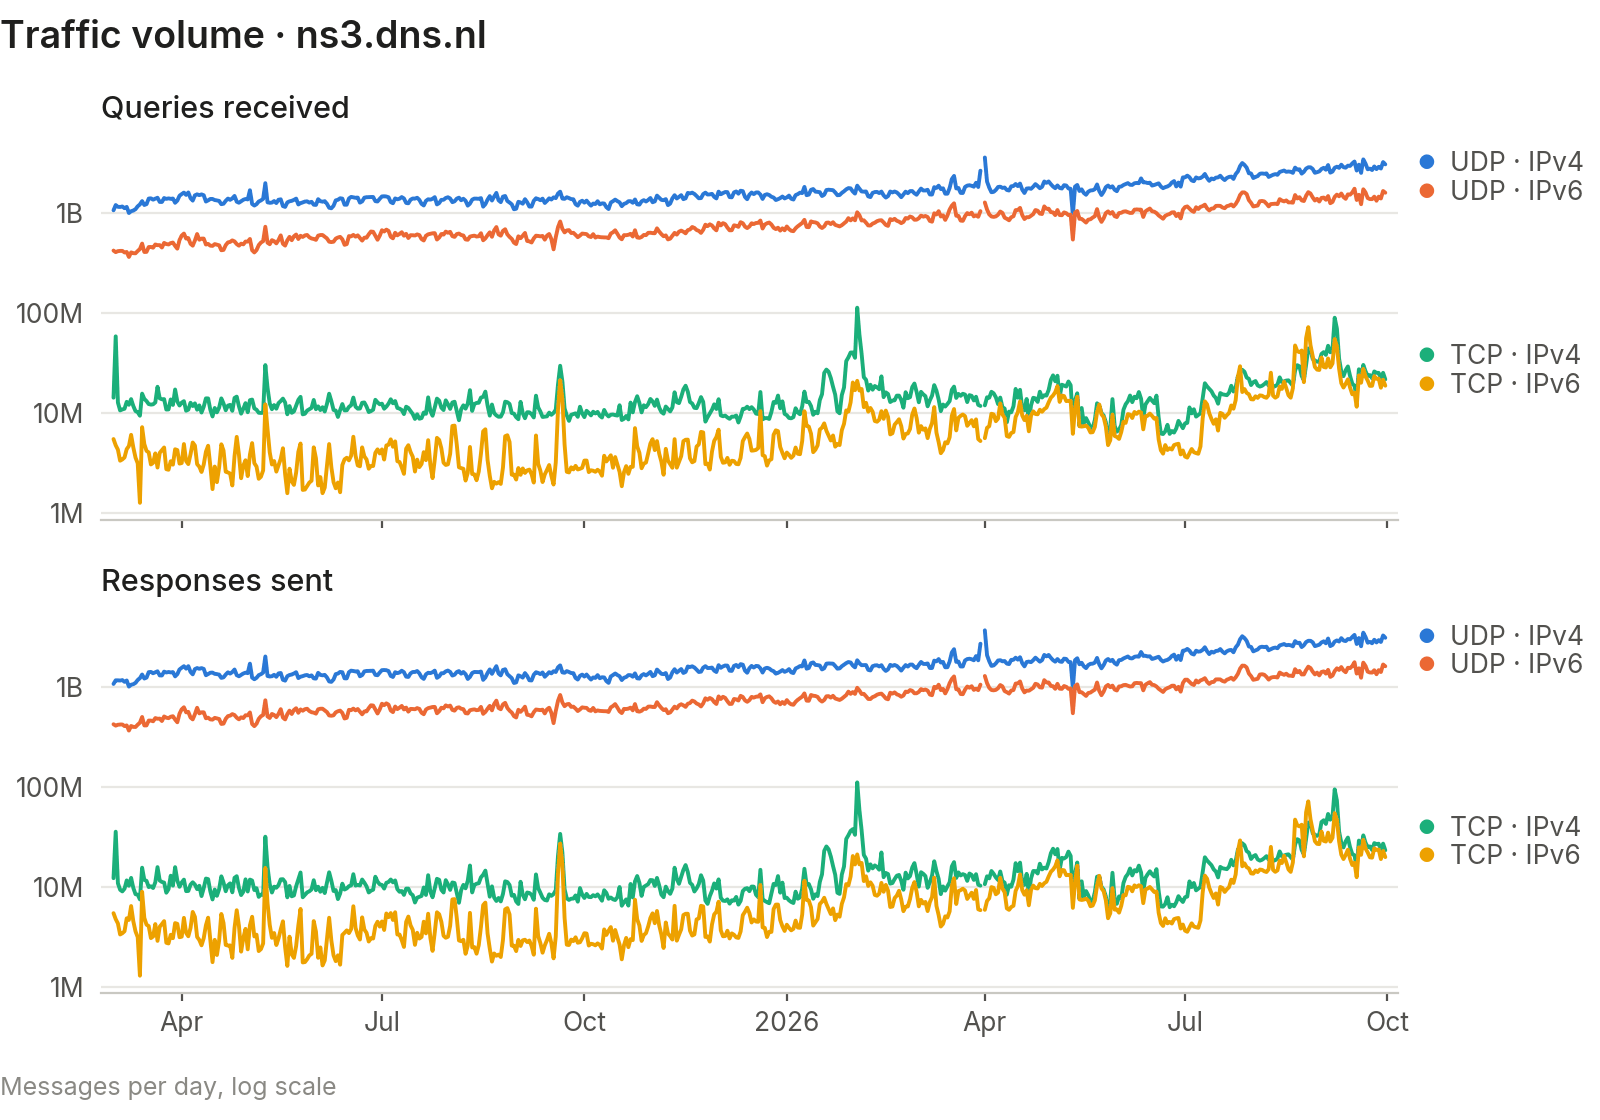
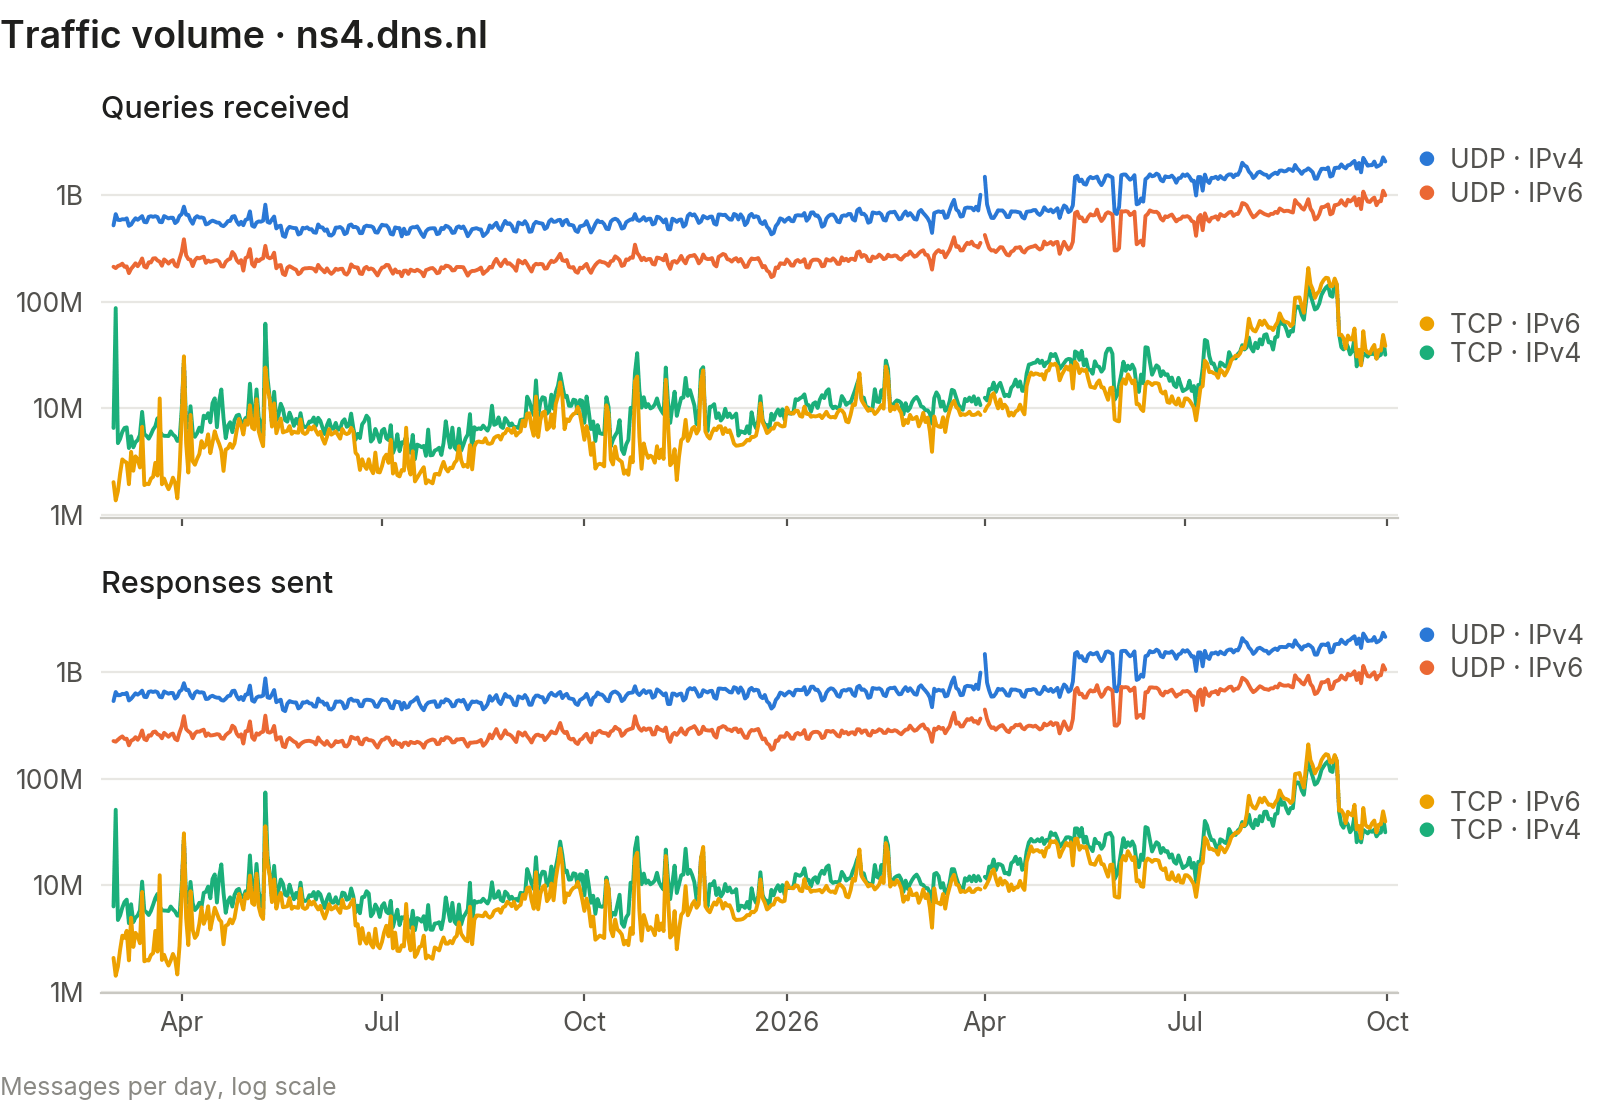
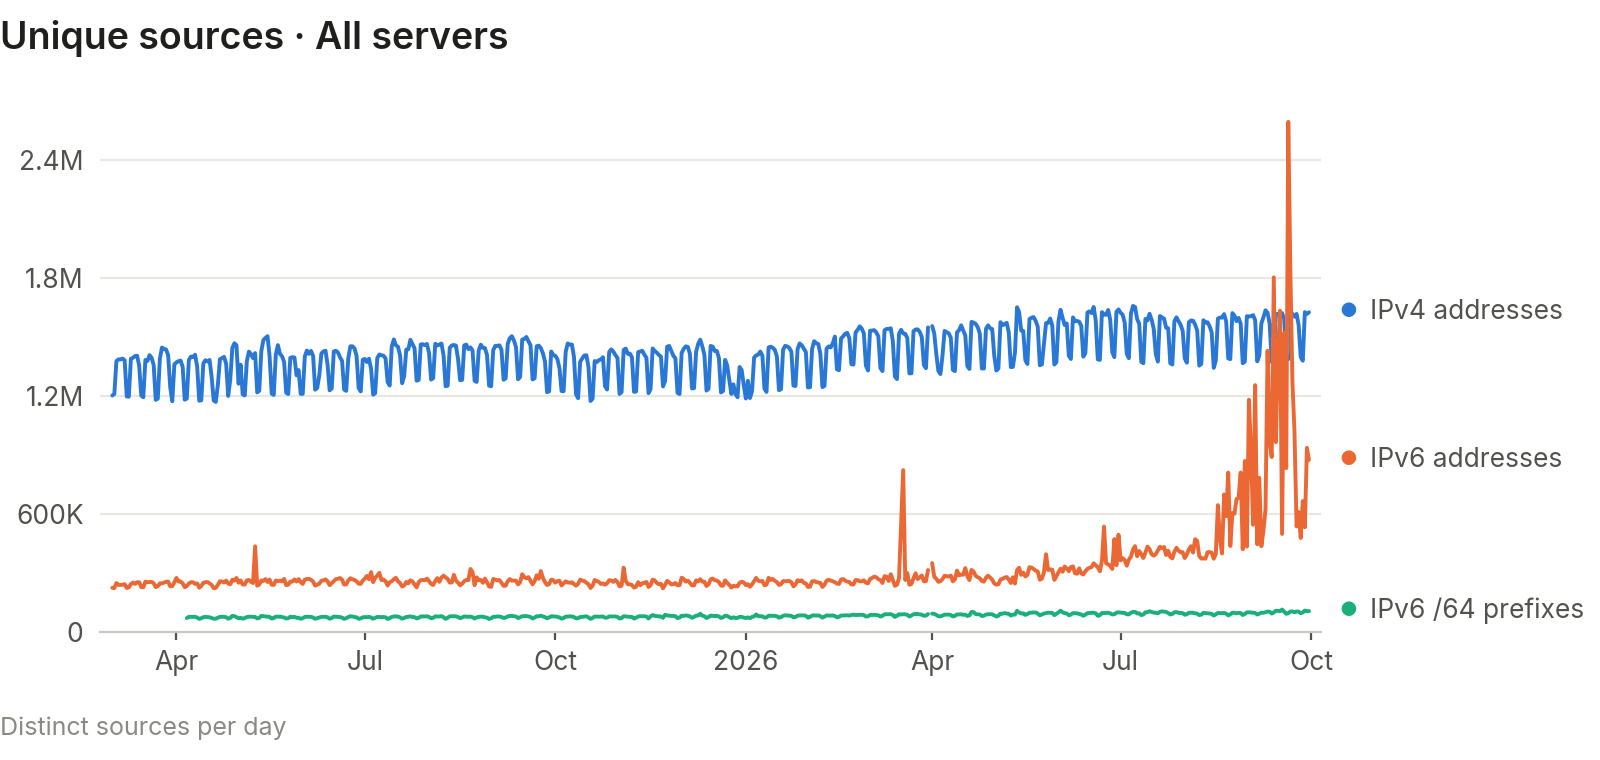
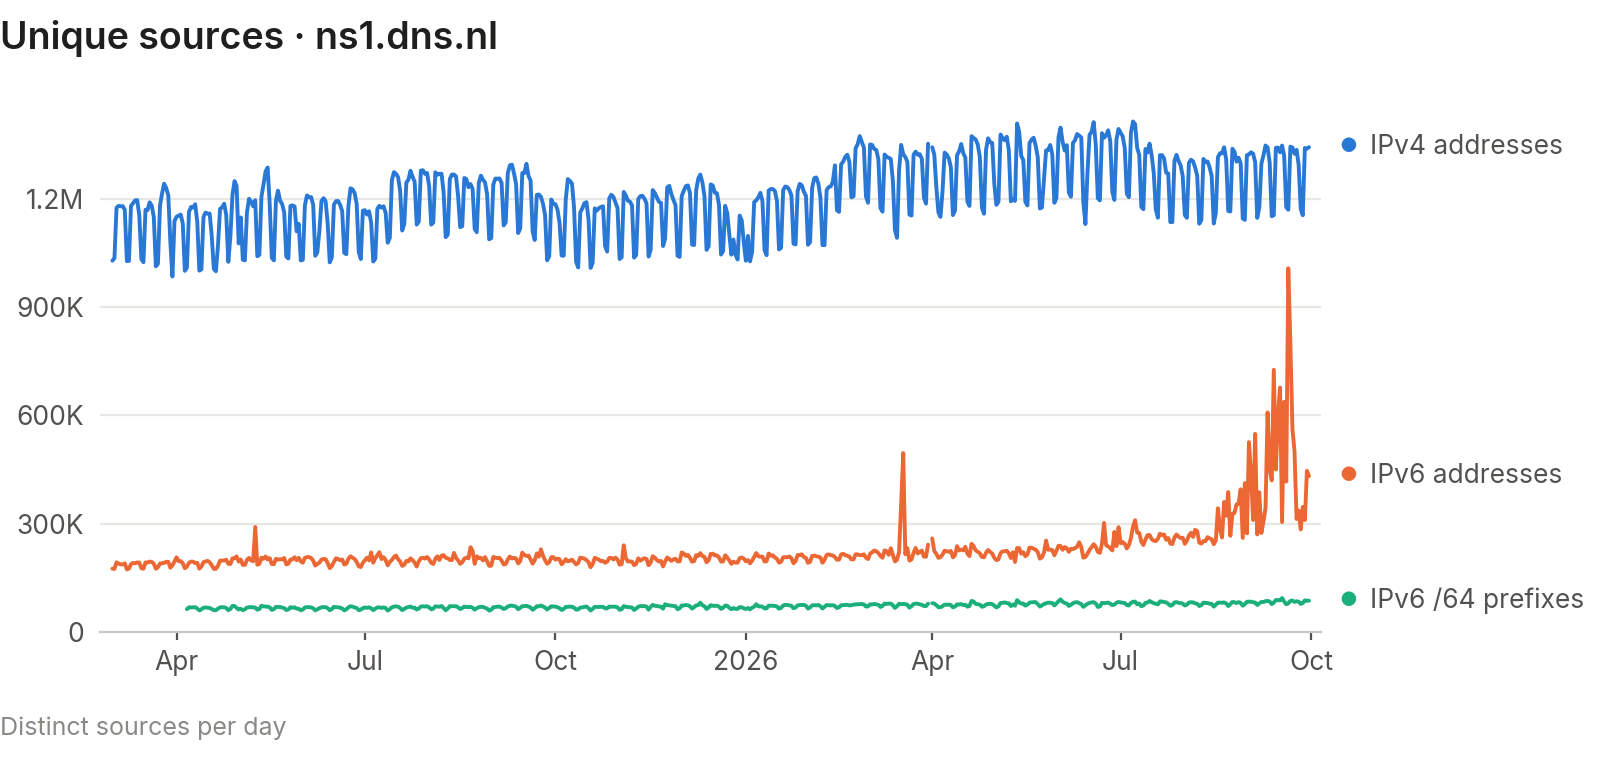
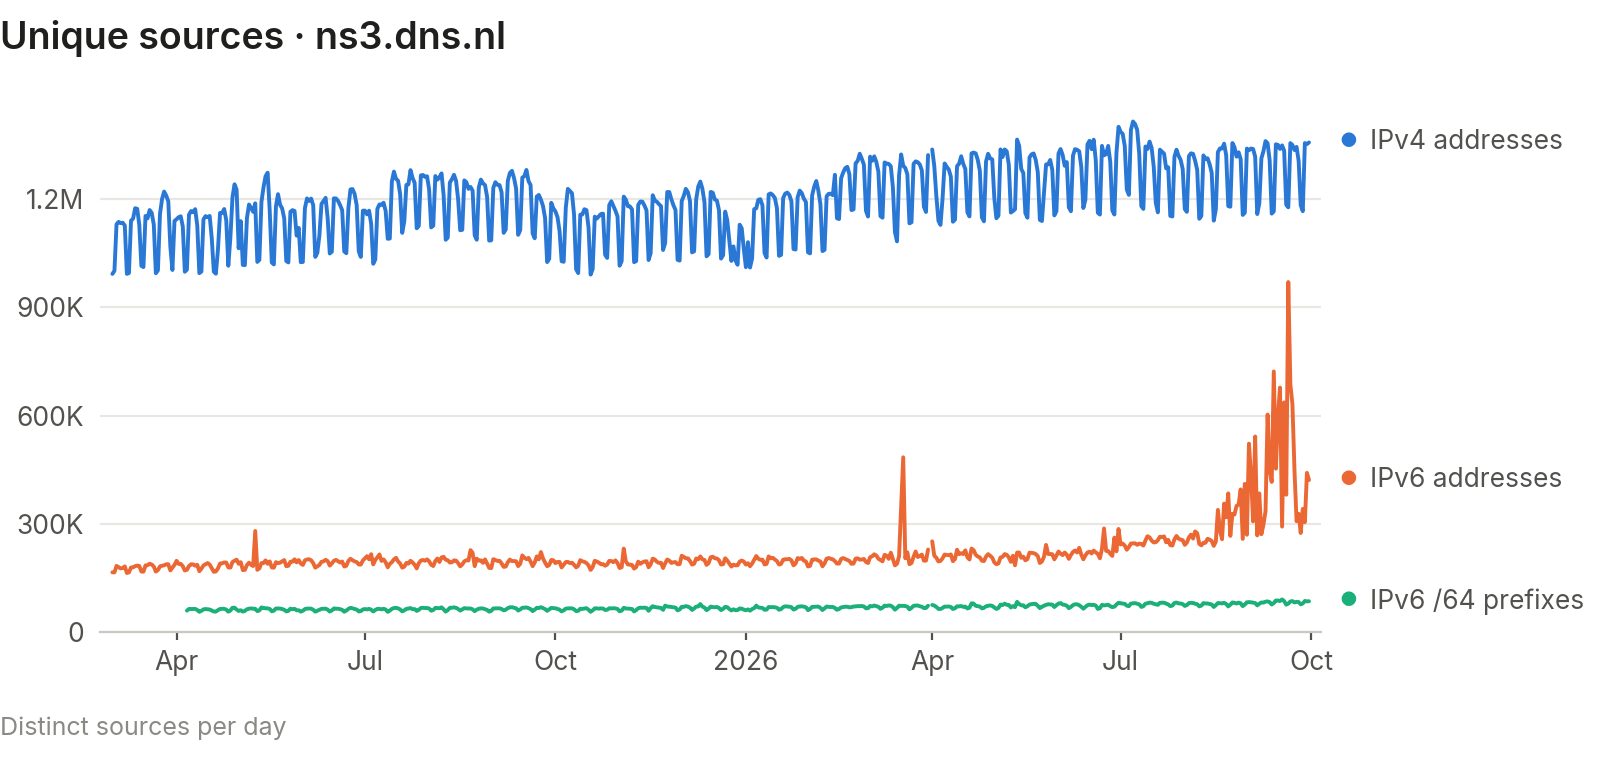
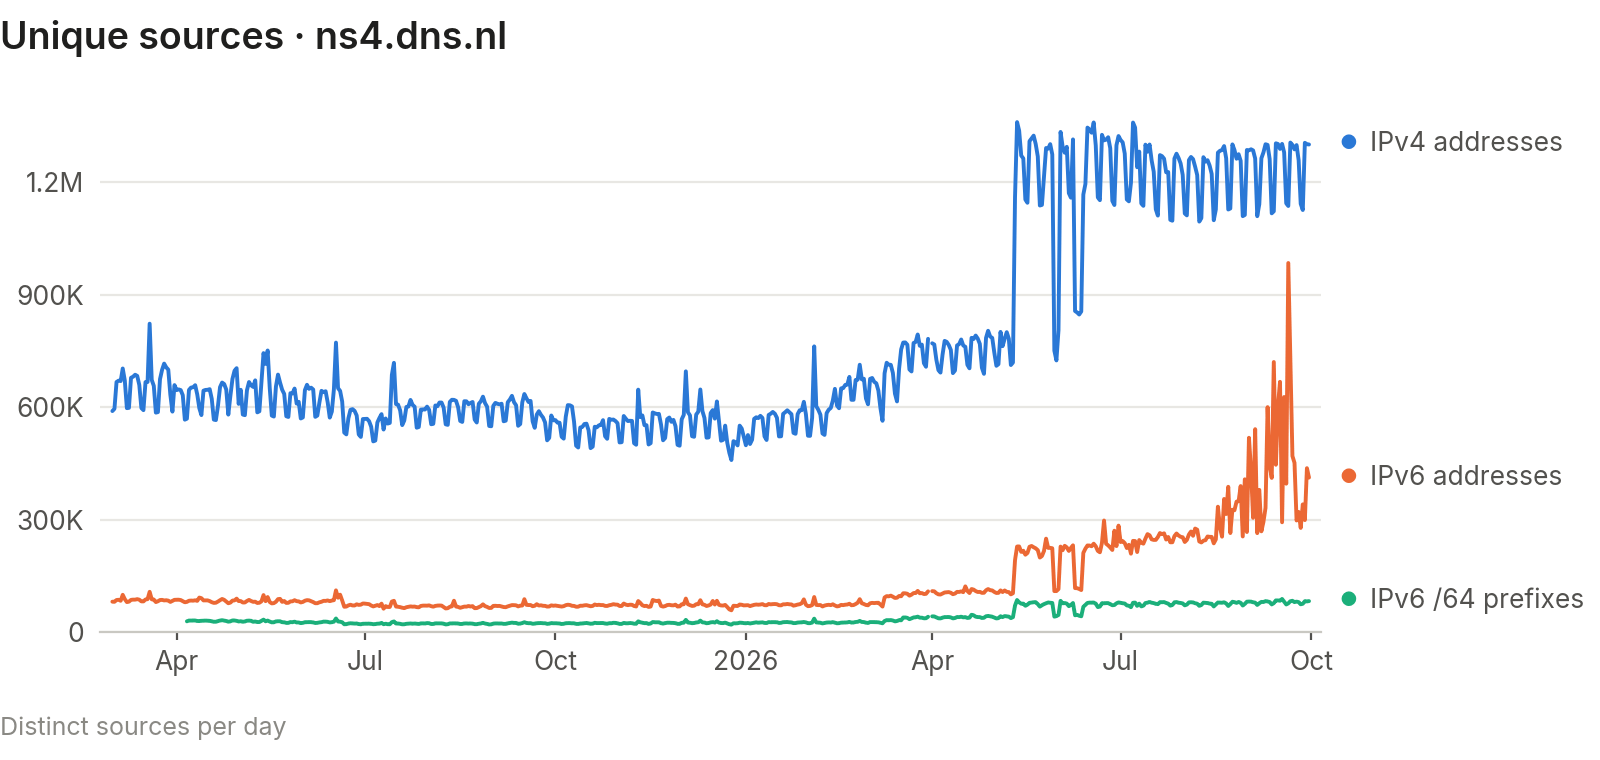
A quick visual view of .nl DNS traffic, drawn from the published metrics files. Each metric has one chart for all three .nl authoritative servers combined, followed by one chart per server: ns1.dns.nl, ns3.dns.nl and ns4.dns.nl.
The charts are updated periodically, not daily. For the latest numbers, see the files.
Traffic volume
Queries received and responses sent, split by IPv4/IPv6 and UDP/TCP.
The y-axis is logarithmic: UDP traffic is about 100 times larger than TCP, and a linear scale would flatten the TCP lines.
Response codes (RCODE)
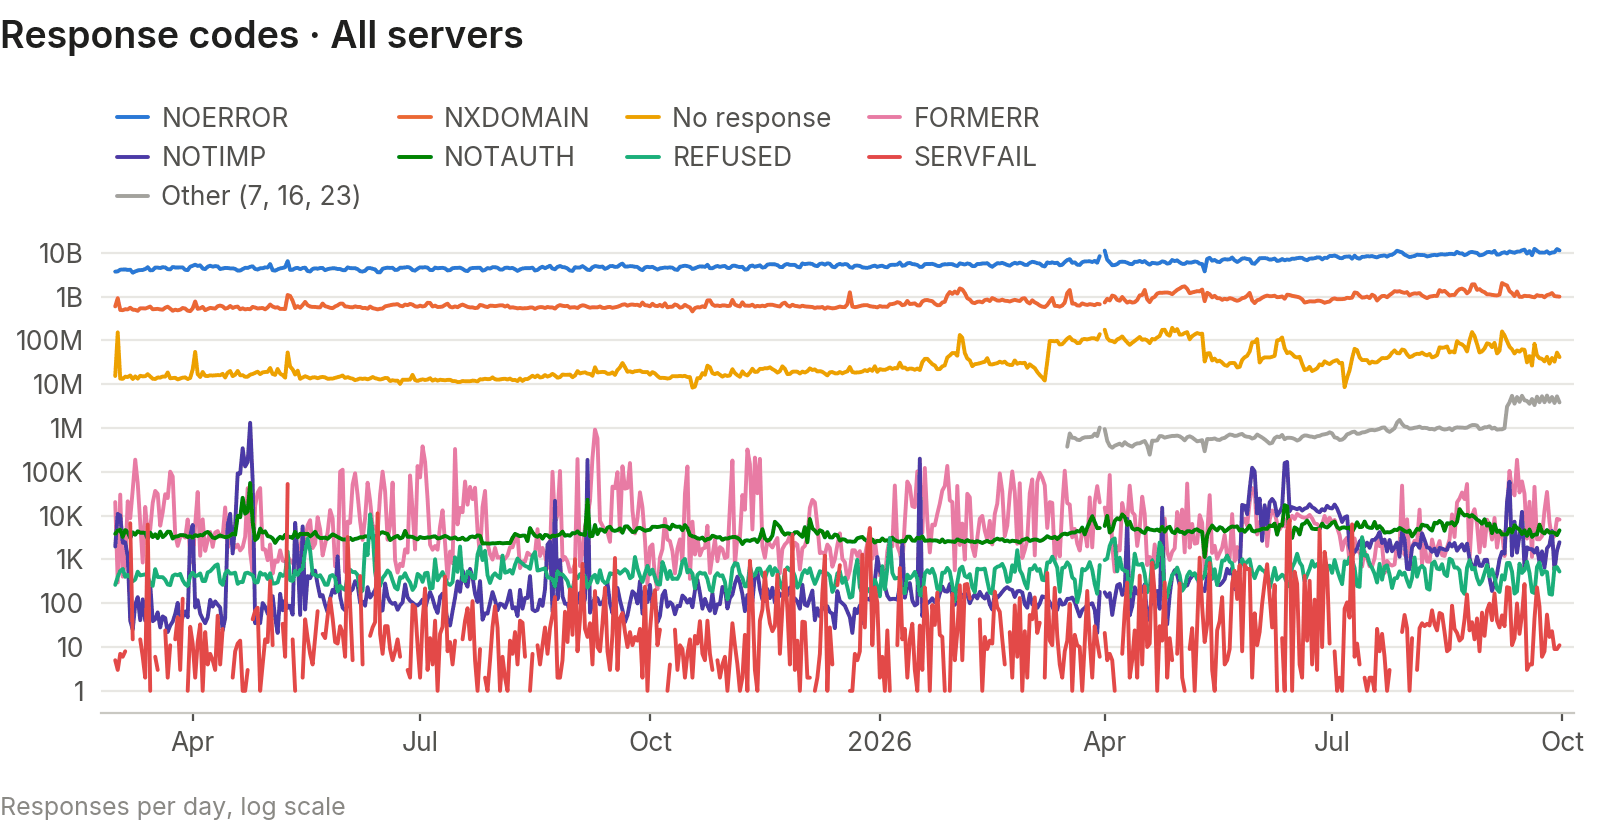
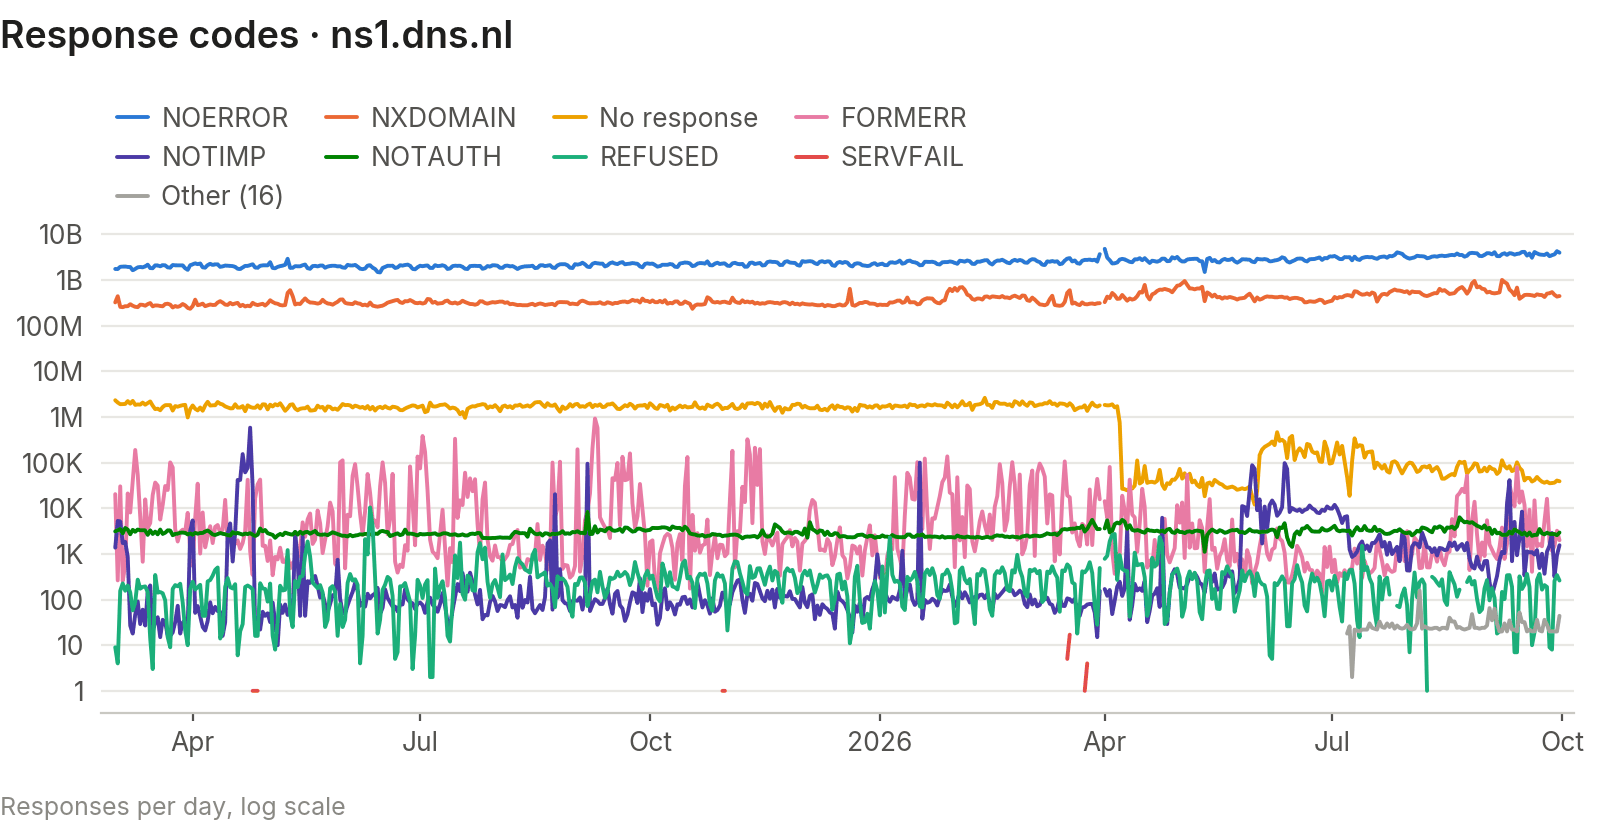
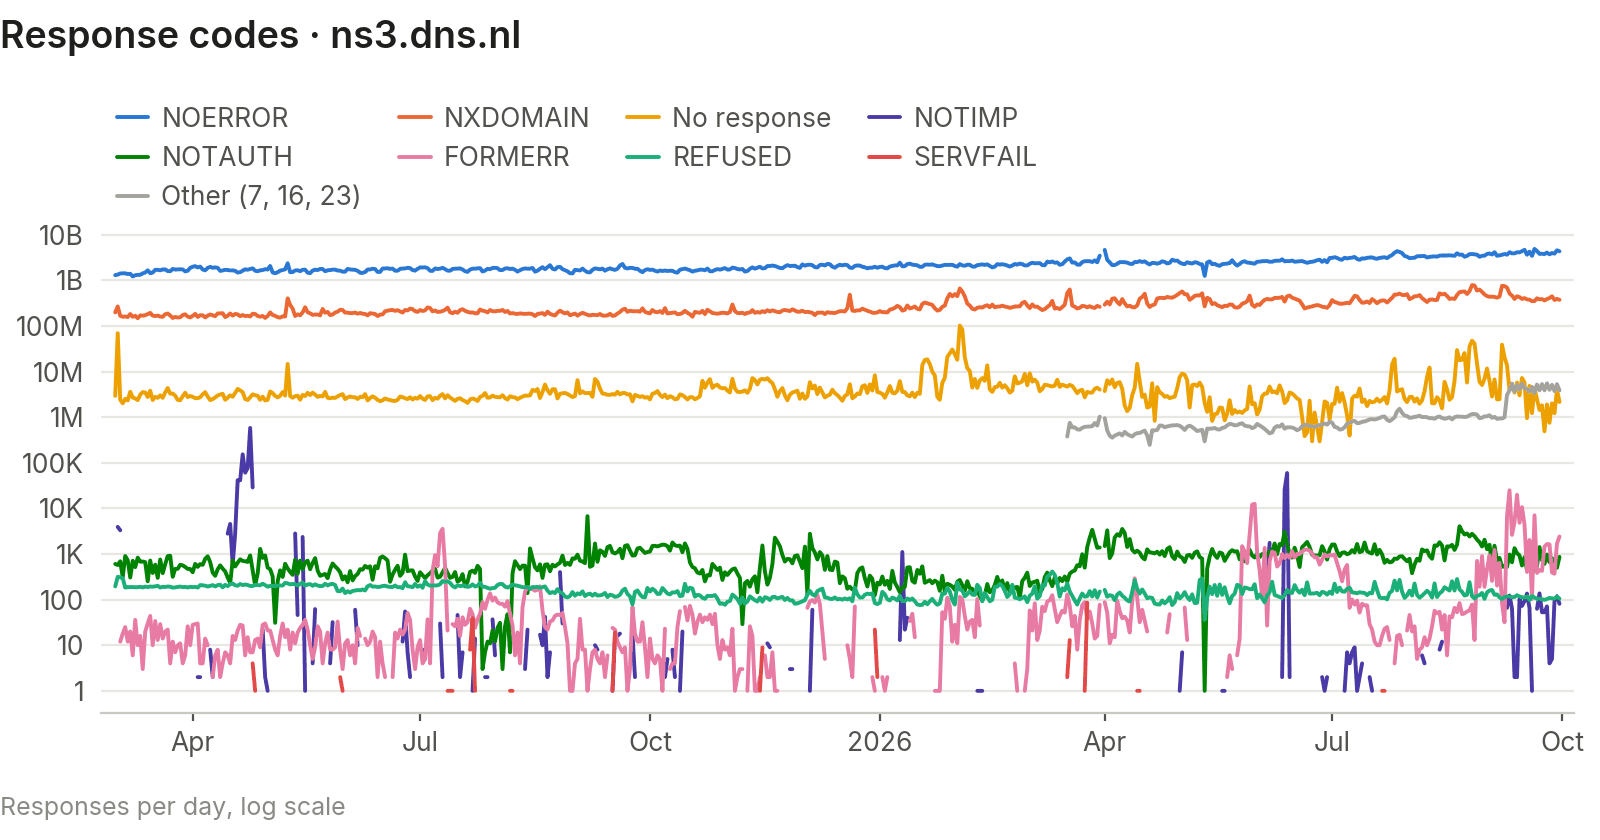
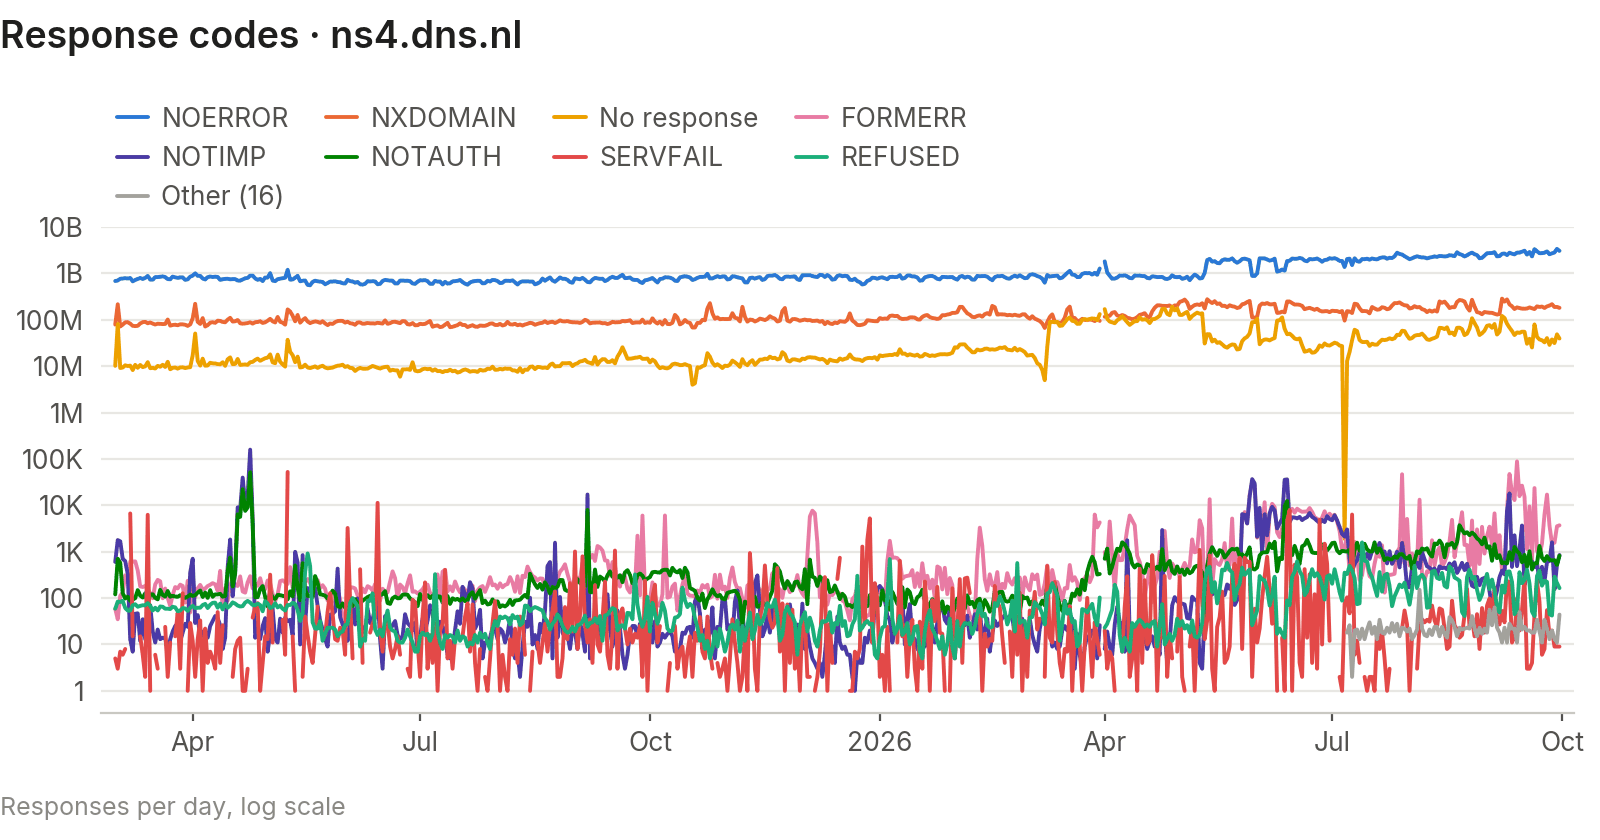
Responses per DNS response code. NOERROR and NXDOMAIN dominate, so the y-axis is logarithmic to keep the rarer codes visible.
Note: -1 is not a real RCODE. It counts queries that received no response.
Unique sources
Distinct IPv4 addresses, IPv6 addresses and IPv6 /64 prefixes seen per day. Linear scale.
Message sizes
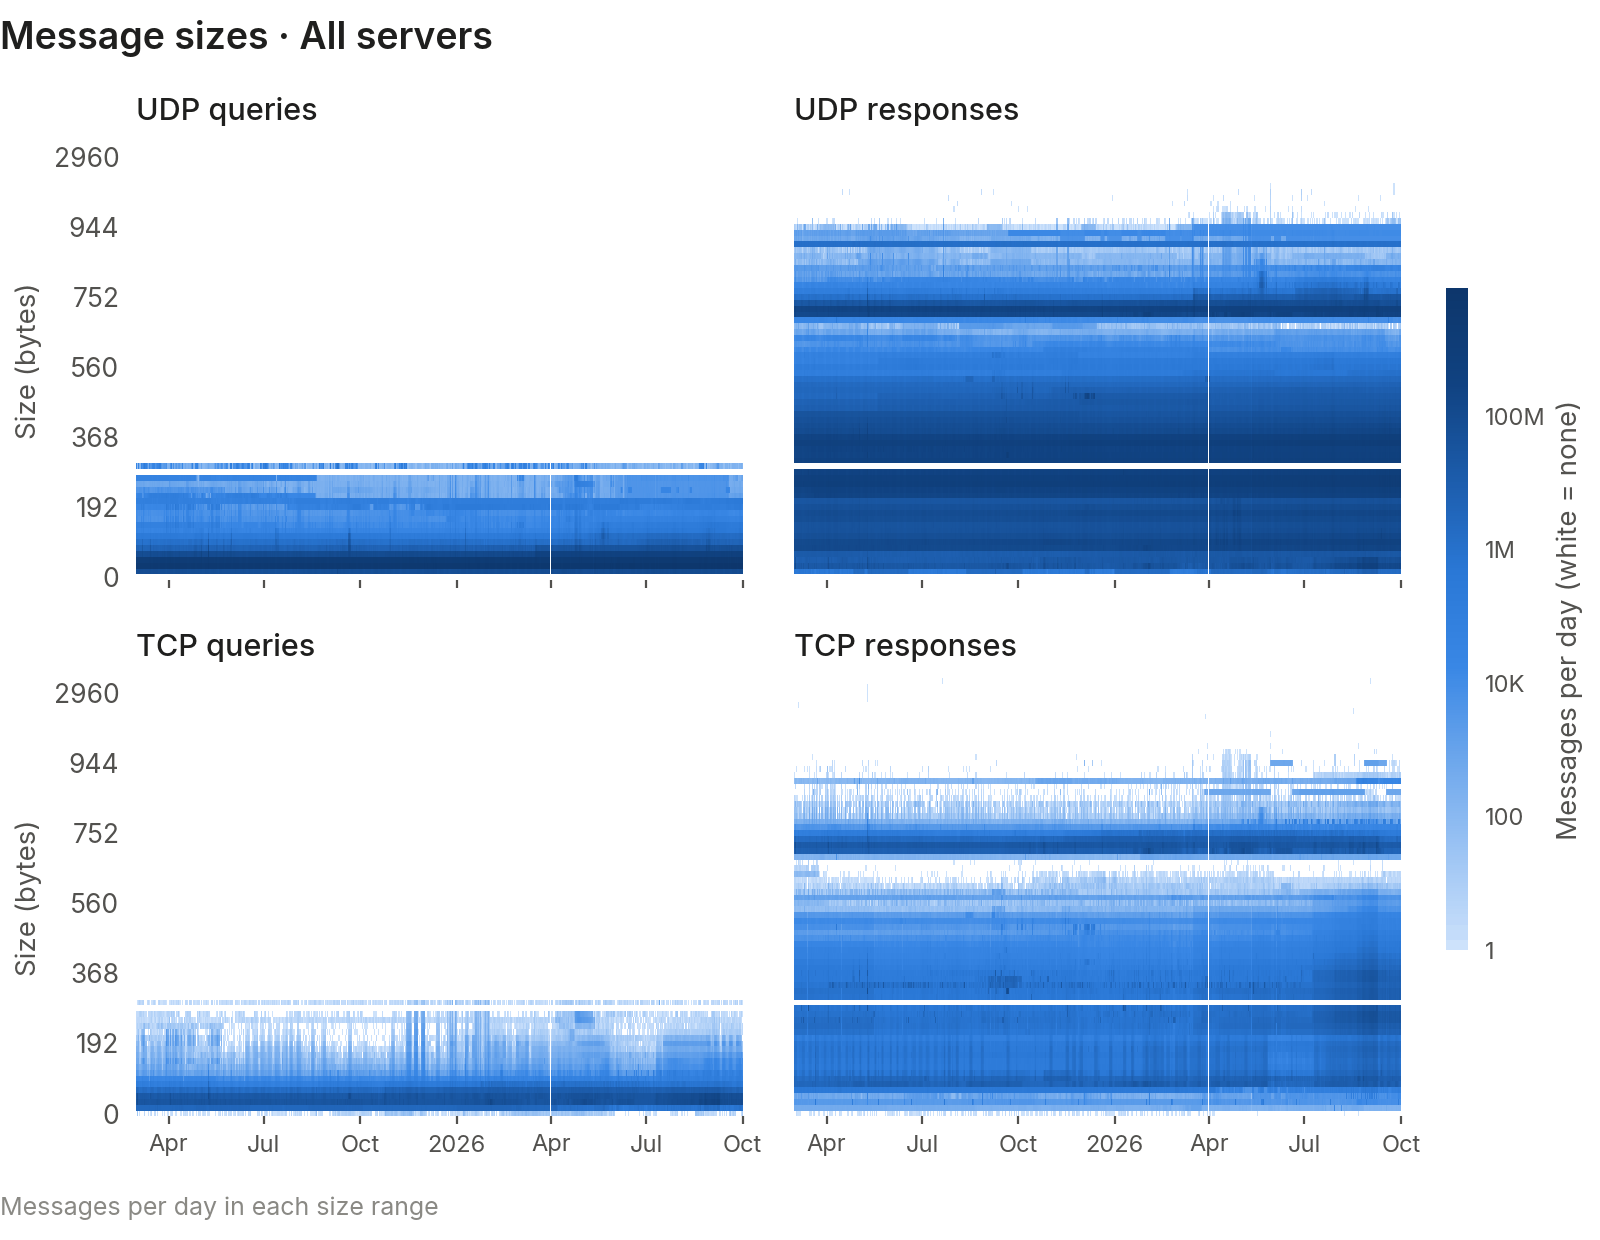
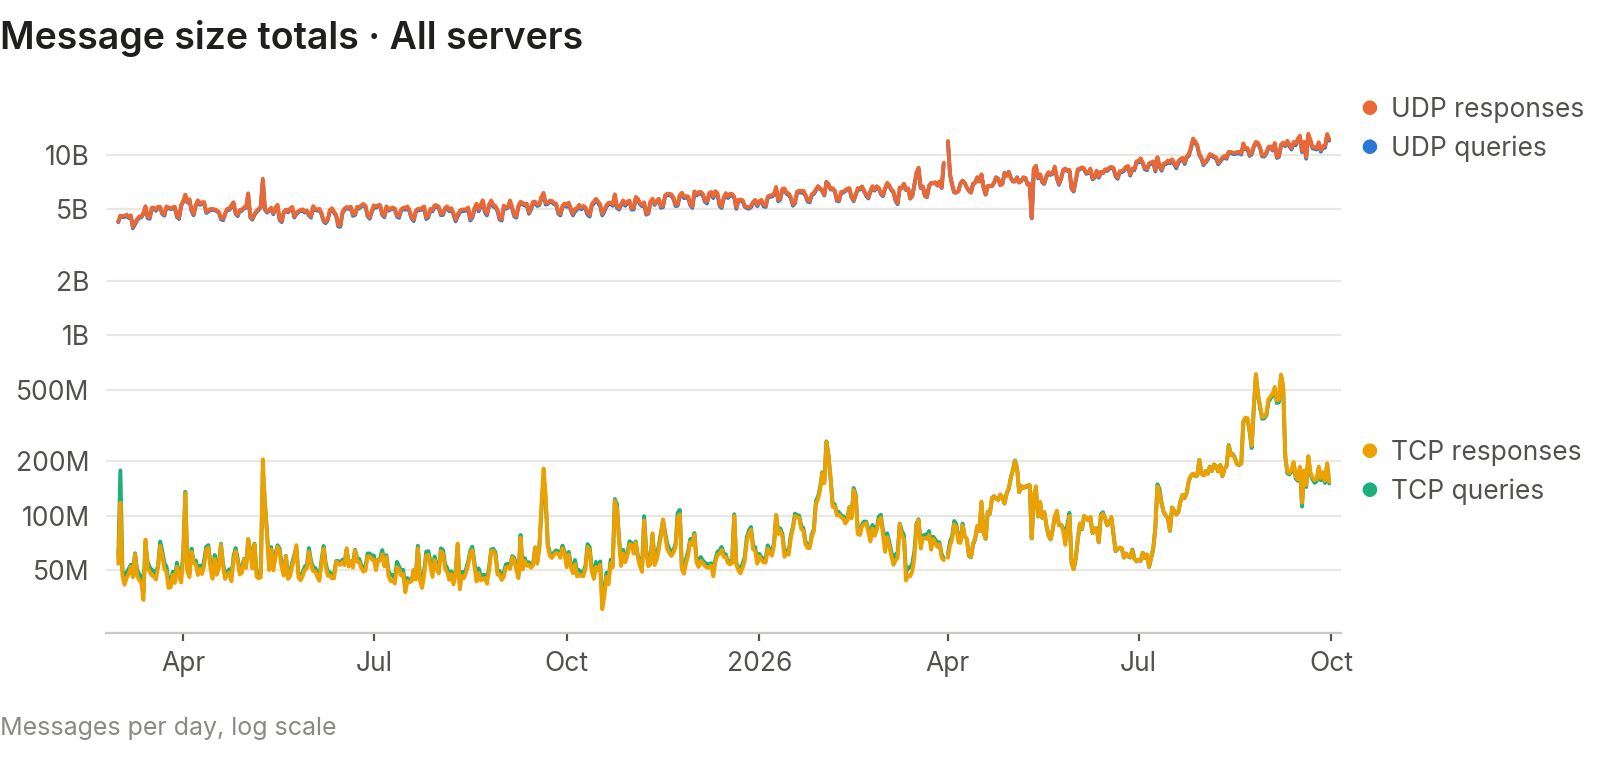
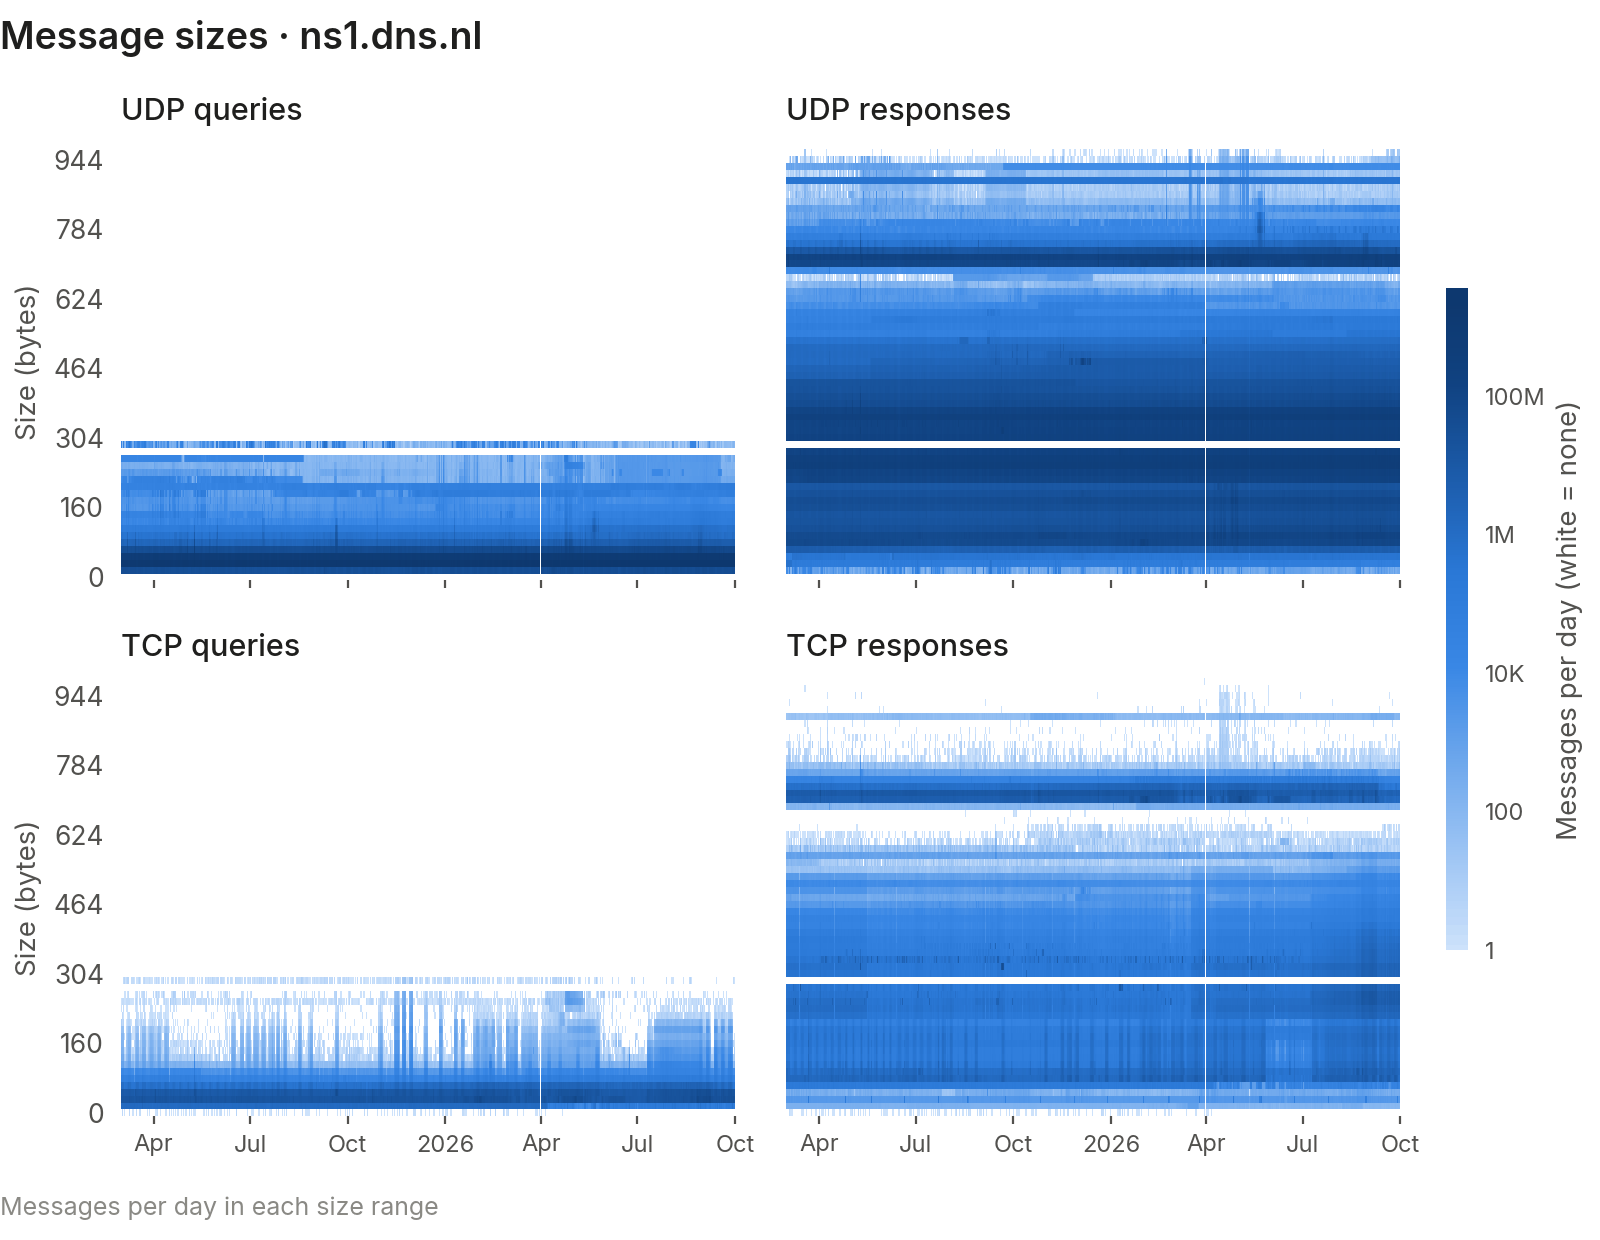
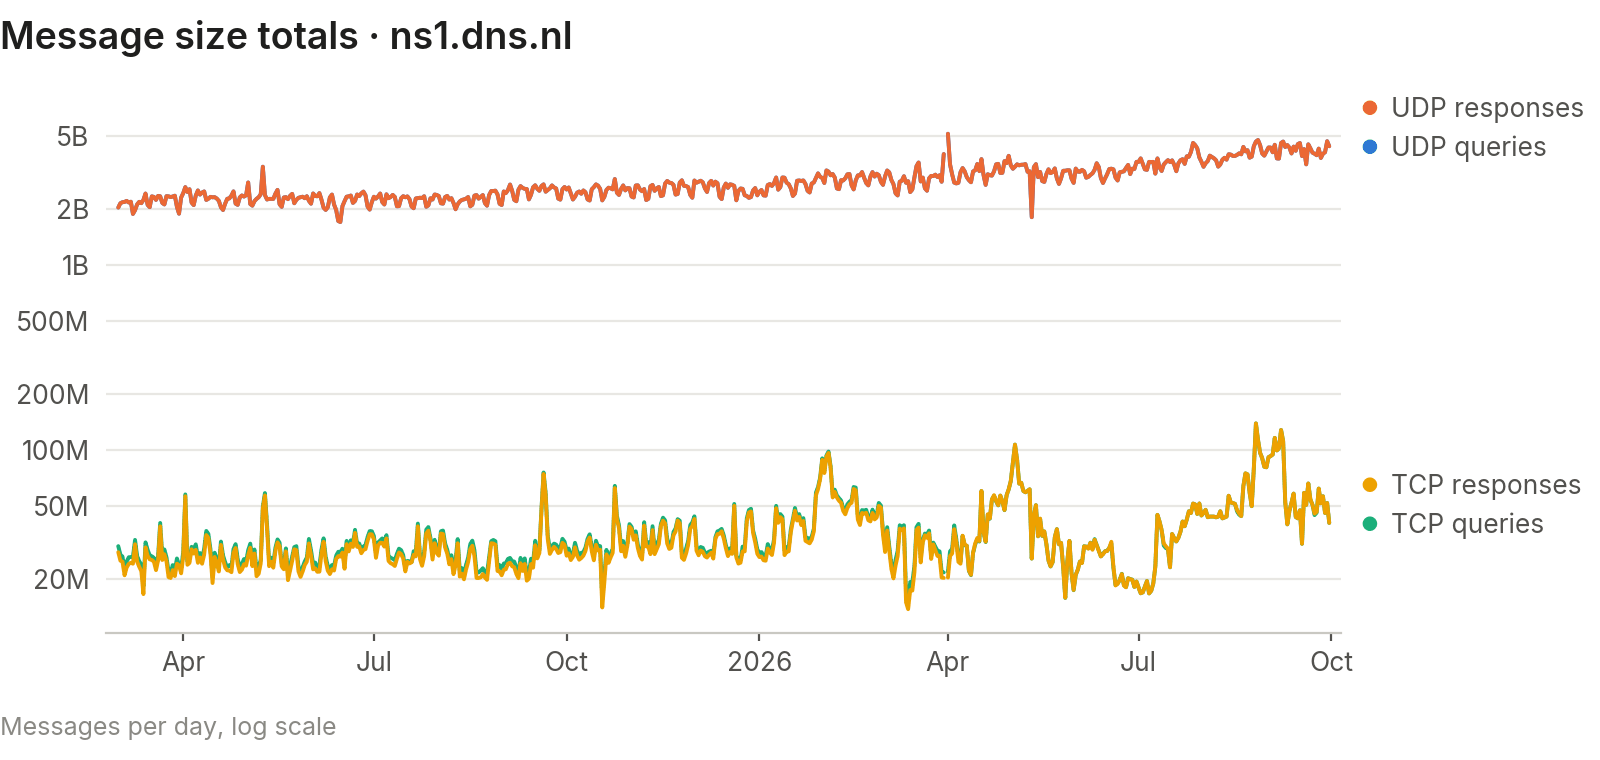
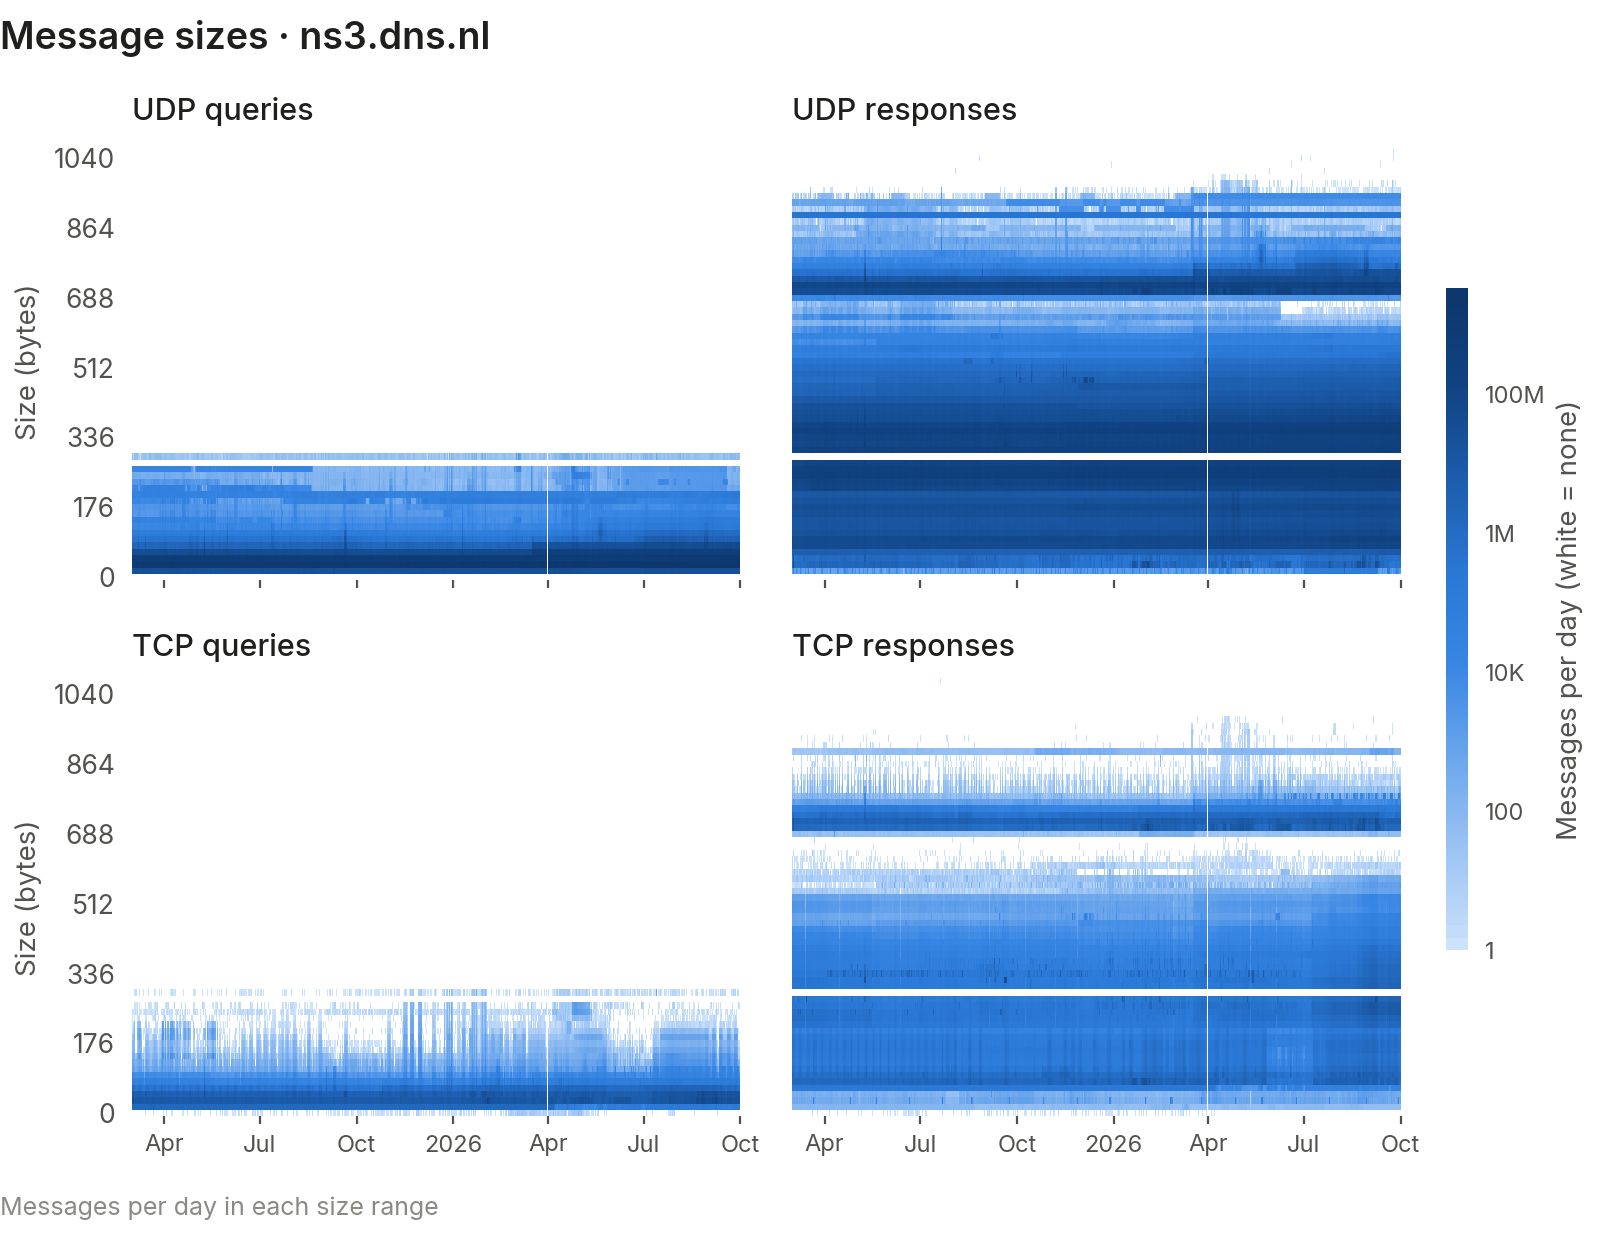
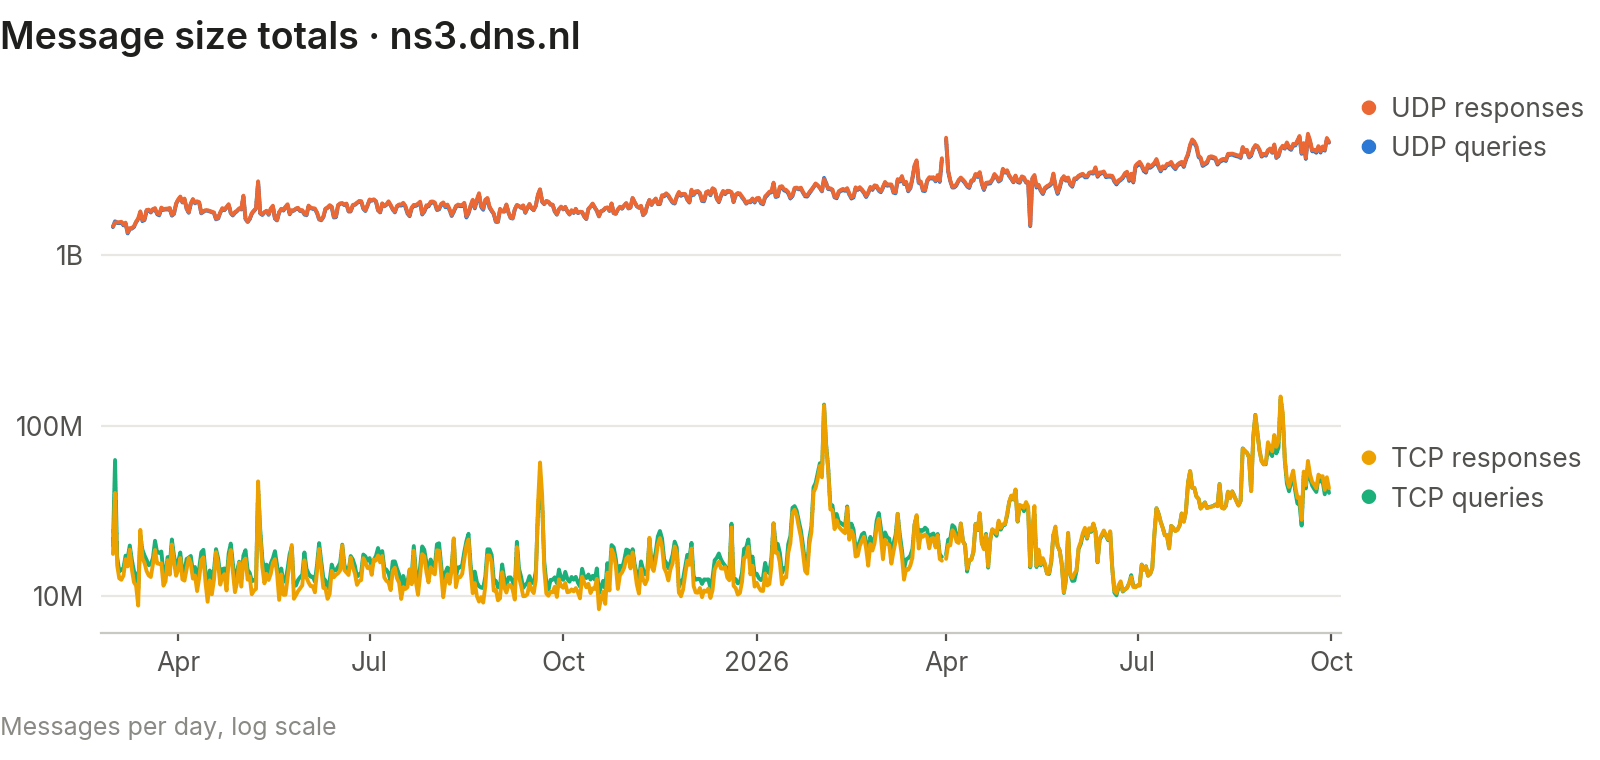
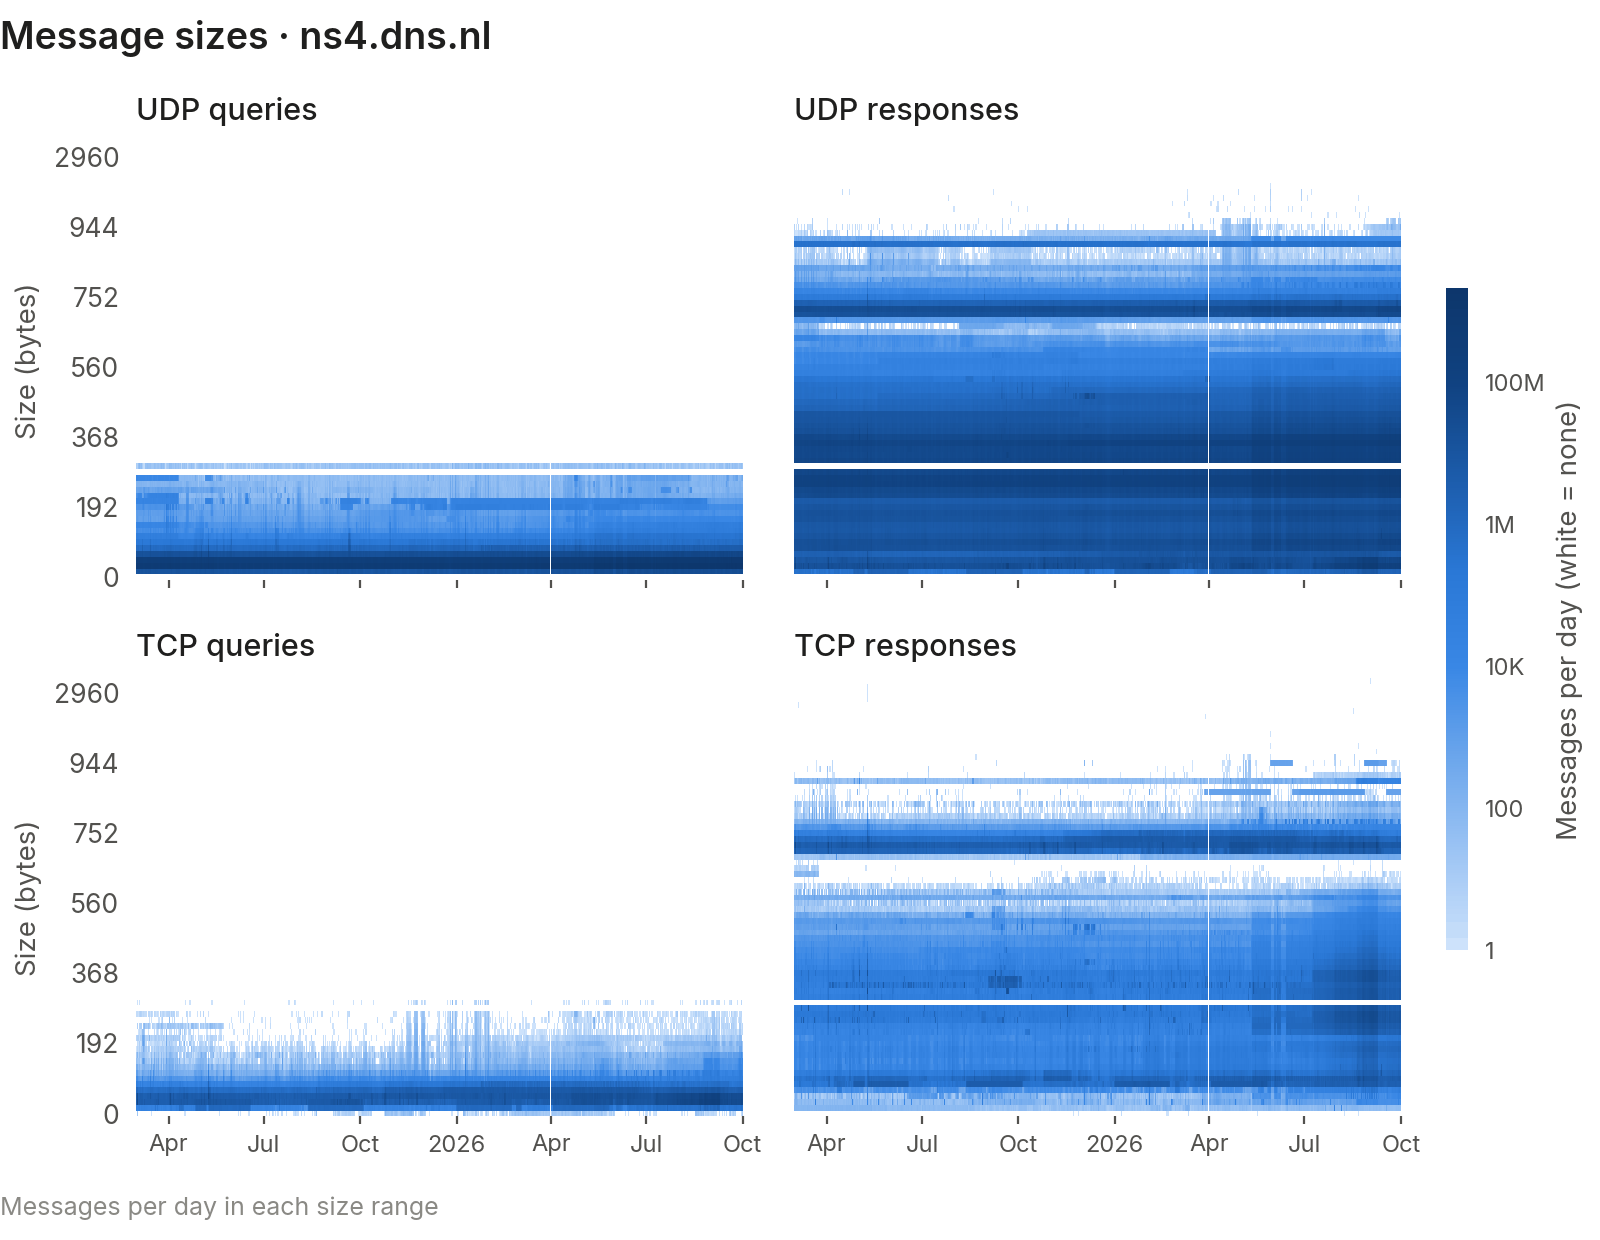
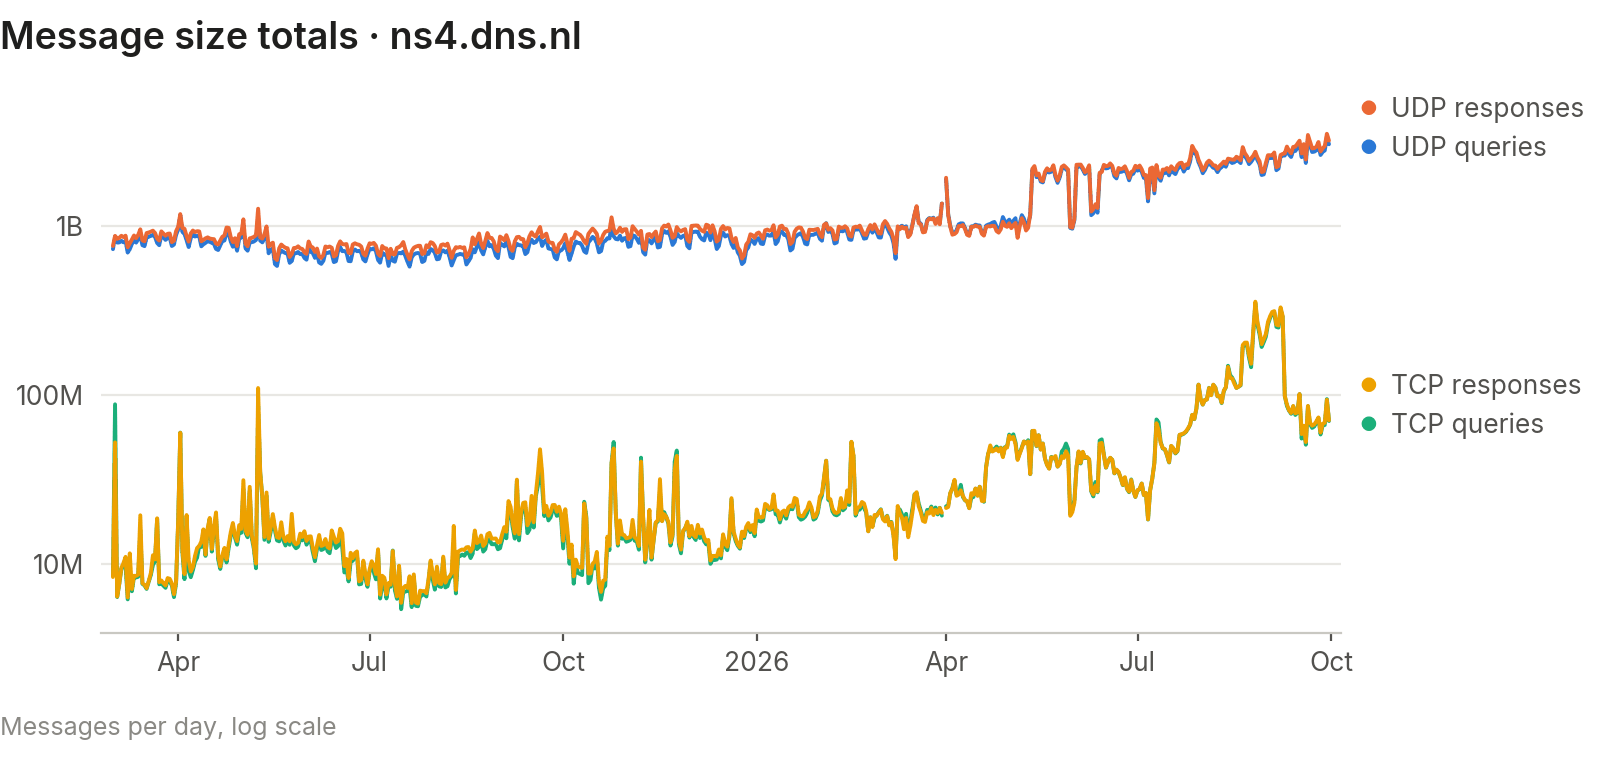
Sizes of UDP and TCP queries and responses.
Each server comes with two charts:
- Heatmap: one column per day, one row per size bucket. Colour shows how many messages fell in that bucket on that day, on a log scale; the colour bar shows actual counts. White means zero.
- Totals: the daily message count per direction, for a quick overview.